
 By admin
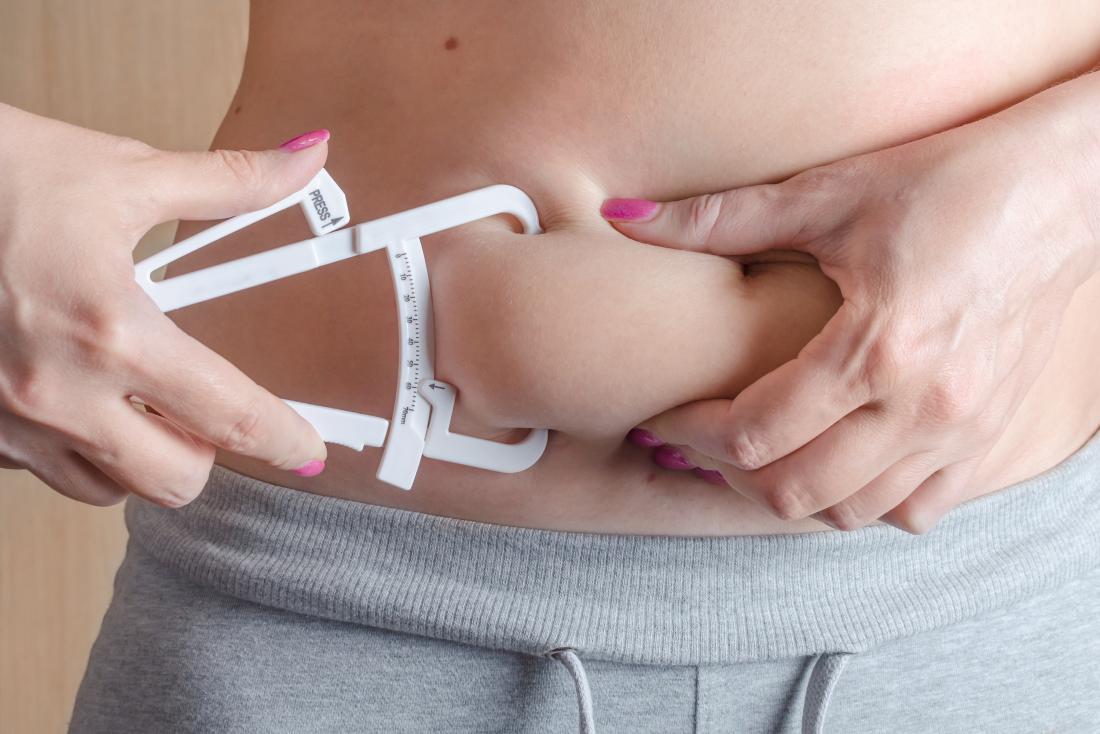
How Do Body Composition Scales Measure Fat and Muscle Simply by Standing on Them?
Introduction
In today’s data-driven health culture, the traditional bathroom scale has undergone a remarkable transformation. Once limited to displaying a single number—total body weight—it has evolved into a sophisticated analytical device capable of estimating body fat percentage, muscle mass, bone content, hydration levels, and even visceral fat. These modern devices, commonly known as body composition scales or smart scales, promise detailed insights into the human body with nothing more than a few seconds of standing barefoot.
At the core of this technological leap lies Bioelectrical Impedance Analysis (BIA), a method that cleverly combines principles of physics, human physiology, and statistical modeling. By sending a harmless electrical signal through the body and analyzing how that signal behaves, these scales attempt to map what lies beneath the skin. While the process feels almost magical to users, it is actually grounded in decades of scientific research and continuous innovation.
This article provides a comprehensive, up-to-date exploration of how body composition scales work, how accurately they measure fat and muscle, and what modern advancements are shaping their future. We will examine the science behind BIA, the algorithms that convert electrical resistance into meaningful health data, the variables that influence accuracy, and how users can interpret results responsibly. Ultimately, understanding how these devices function empowers individuals to use them as effective tools for long-term health monitoring rather than sources of confusion or obsession.
1. The Scientific Foundation of Body Composition Scales
1.1 Understanding Bioelectrical Impedance Analysis (BIA)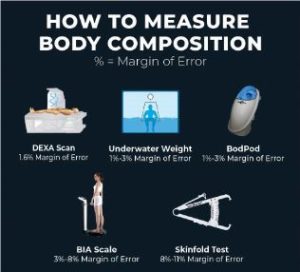
Bioelectrical Impedance Analysis is the cornerstone technology behind most consumer body composition scales. The concept is elegantly simple: when an electrical current passes through the human body, different tissues resist that current in different ways. This resistance, known as impedance, can be measured and analyzed.
When you step onto a smart scale barefoot, metal electrodes embedded in the surface send a very low-level electrical current—so weak that it is completely imperceptible and safe—up through one foot, across the lower body and torso, and down through the other foot. The scale then measures how quickly and easily the current completes this journey.
The key insight is that the human body is not electrically uniform. Muscle tissue, which contains a high percentage of water and electrolytes, conducts electricity efficiently. Fat tissue, on the other hand, contains significantly less water and acts as an electrical insulator. Bone and air-filled spaces offer even greater resistance. By analyzing the degree of impedance encountered, the scale can estimate the proportion of fat-free mass to fat mass within the body.
1.2 Electrical Conductivity and Human Tissue Composition
Approximately 60% of the adult human body is composed of water, most of which resides within lean tissue such as muscles and organs. Because water is an excellent conductor of electricity, bodies with higher muscle mass generally show lower impedance. Fat tissue, containing far less water, slows the electrical current and increases impedance values.
This relationship allows BIA-based devices to infer body composition indirectly. Importantly, the scale does not “see” fat or muscle directly. Instead, it measures electrical behavior and translates it into biological estimates using mathematical models.
2. From Raw Data to Results: The Role of Algorithms
2.1 Why Impedance Alone Is Not Enough
While impedance measurement is essential, it is only one piece of the puzzle. On its own, impedance cannot distinguish between individuals of different heights, ages, or biological sexes. This is why smart scales require users to input biometric information such as age, height, sex, and sometimes activity level or athletic status.
These additional variables allow the scale’s internal software to contextualize impedance readings. The device applies predictive equations developed through extensive population studies comparing impedance values with body composition data obtained from clinical gold standards such as DEXA scans, hydrostatic weighing, and MRI imaging.
2.2 The Statistical Nature of Body Composition Estimates
It is important to understand that body composition scales operate on probability, not certainty. The algorithms essentially state: “Based on millions of people with similar characteristics and impedance values, the most statistically likely body fat percentage is X.”
This reliance on population averages explains why individual results may sometimes feel inaccurate. Variations in limb length, muscle density, ethnicity, or unique physiology may not align perfectly with algorithmic assumptions. Nonetheless, when used consistently, these statistical models are highly effective at tracking changes over time.
3. Key Factors That Influence Measurement Accuracy
3.1 Hydration Status: The Most Critical Variable
Hydration is the single most influential factor affecting BIA accuracy. Because the method depends heavily on body water content, even minor fluctuations can significantly alter results.
- Dehydration increases electrical resistance, often leading to an overestimation of body fat percentage.
- Overhydration, recent fluid intake, or post-exercise water retention can decrease impedance and underestimate body fat.
For best results, experts recommend weighing under consistent conditions—ideally in the morning, after using the bathroom, before eating, drinking, or exercising.
3.2 Lifestyle and Physiological Influences
Several additional factors can influence readings:
- Recent food intake alters water distribution in the digestive system.
- Alcohol consumption temporarily disrupts hydration balance.
- Menstrual cycle phases affect fluid retention in women.
- Skin temperature impacts electrical conductivity.
- Foot placement and contact quality can affect signal transmission.
Understanding these variables helps users avoid misinterpreting short-term fluctuations as meaningful changes in body composition.
4. Types of Body Composition Scales and Measurement Approaches
4.1 Foot-to-Foot BIA Scales
Most household smart scales use a foot-to-foot BIA configuration, where the electrical current travels primarily through the lower body. While convenient and affordable, this method provides limited insight into upper-body composition and trunk fat distribution.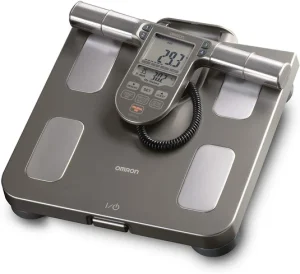
4.2 Segmental BIA and Hand-to-Foot Systems
More advanced devices use segmental BIA, incorporating electrodes for both hands and feet. This approach sends electrical currents through multiple pathways, allowing the scale to estimate muscle and fat distribution in specific body segments such as arms, legs, and torso.
Segmental analysis improves accuracy, particularly for individuals with uneven muscle development or central obesity.
5. Modern Innovations Enhancing Body Composition Analysis
5.1 Multi-Frequency BIA (MF-BIA)
Traditional BIA systems operate at a single frequency, typically around 50 kHz. Newer multi-frequency BIA devices use a range of frequencies to distinguish between intracellular water and extracellular water.
Low frequencies primarily measure water outside cells, while higher frequencies penetrate cell membranes to estimate total body water. This refinement enhances accuracy, especially in athletes, older adults, and individuals with atypical hydration patterns.
5.2 Bioimpedance Spectroscopy (BIS)
Bioimpedance Spectroscopy expands upon MF-BIA by analyzing impedance across a wide frequency spectrum. This advanced technique provides more detailed insights into cellular health, fluid balance, and body cell mass, bridging the gap between consumer devices and clinical tools.
5.3 3D Body Scanning and Optical Sensors
Some premium smart scales now integrate 3D body scanning technology using optical sensors or depth cameras. These systems create a digital model of the user’s body shape, measuring circumferences and volume changes.
When combined with BIA data and artificial intelligence, 3D scanning improves estimates of visceral fat and allows users to visually track physical changes over time.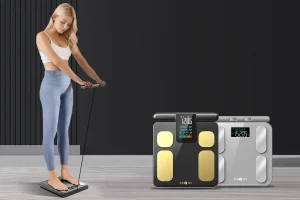
6. Interpreting Key Body Composition Metrics
6.1 Body Fat Percentage
Body fat percentage is the most widely referenced metric. Unlike body weight, it reflects the proportion of fat relative to total mass. Healthy ranges vary by age and sex, but trends over time are far more important than absolute values.
6.2 Muscle Mass and Skeletal Muscle Index
Smart scales estimate skeletal muscle mass, a critical indicator of metabolic health, strength, and longevity. Preserving or increasing muscle mass while reducing fat is a hallmark of effective fitness and nutrition strategies.
6.3 Visceral Fat Estimation
Visceral fat surrounds internal organs and is strongly linked to cardiovascular disease, insulin resistance, and inflammation. While smart scales estimate visceral fat indirectly, consistent readings can help users monitor metabolic risk trends.
6.4 Additional Metrics
- Total Body Water (TBW) for hydration tracking
- Bone Mineral Content as a rough stability indicator
- Basal Metabolic Rate (BMR) for calorie planning
- Protein mass as an indirect marker of lean tissue quality
7. Limitations of Body Composition Scales
Despite technological advances, consumer-grade body composition scales remain estimation tools, not diagnostic instruments. Their greatest value lies in monitoring relative changes over time, not providing clinically precise measurements.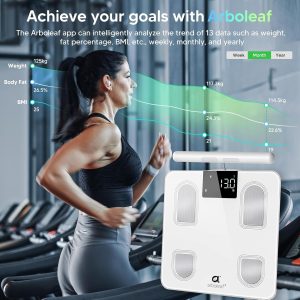
For medical diagnosis or research-grade accuracy, techniques such as DEXA, Bod Pod, and MRI scans remain superior, though they are costly and impractical for frequent use.
Conclusion
Body composition scales represent a powerful intersection of science, technology, and everyday health management. By leveraging Bioelectrical Impedance Analysis, advanced algorithms, and modern sensor integration, these devices transform a simple daily routine into a meaningful source of physiological insight.
While their measurements are influenced by hydration, lifestyle factors, and statistical assumptions, their true strength lies in consistency and trend analysis. When used correctly, body composition scales help individuals move beyond the limitations of body weight alone, offering a clearer picture of fat loss, muscle gain, and metabolic health.
Rather than chasing perfect numbers, users should view these devices as feedback tools—guides that support smarter nutrition, training, and lifestyle decisions. As technology continues to evolve, body composition scales are poised to become even more personalized, accurate, and integrated into the broader digital health ecosystem.
How Police Dogs Smell Hidden Drugs